The following tutorial steps you through how to build a debtors report using Sharperlight.
There are a few different ways in which you could approach this report so we will focus on the concepts and you can the tailor the report to your own requirements.
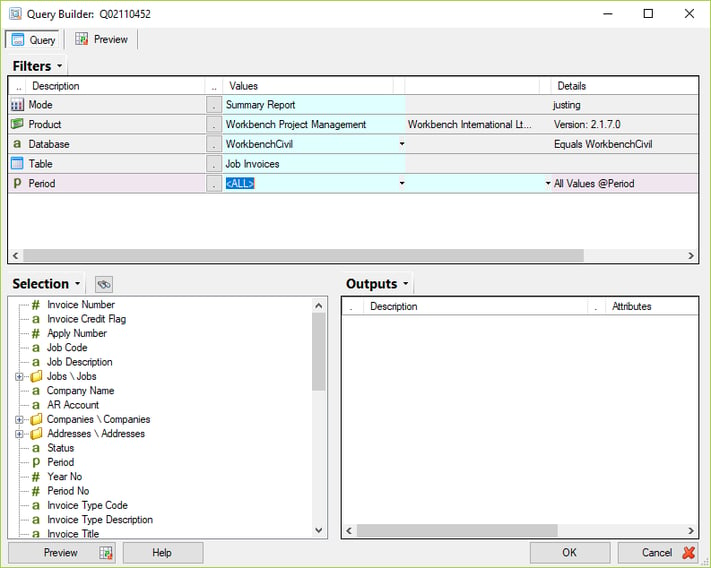
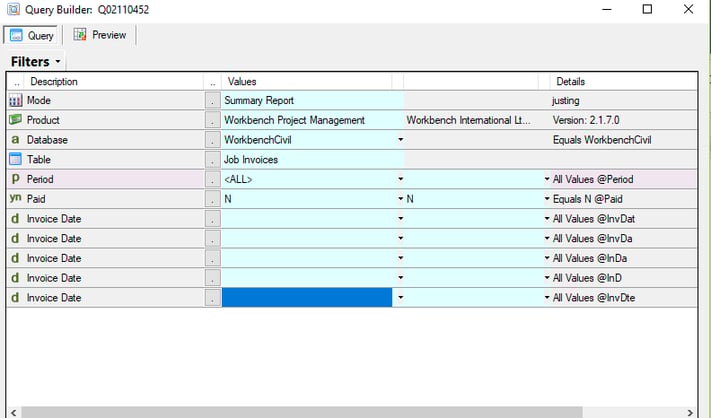
Start by creating a new Query in the Publisher.
We want to create a Summary Report and report from the Job Invoices table.
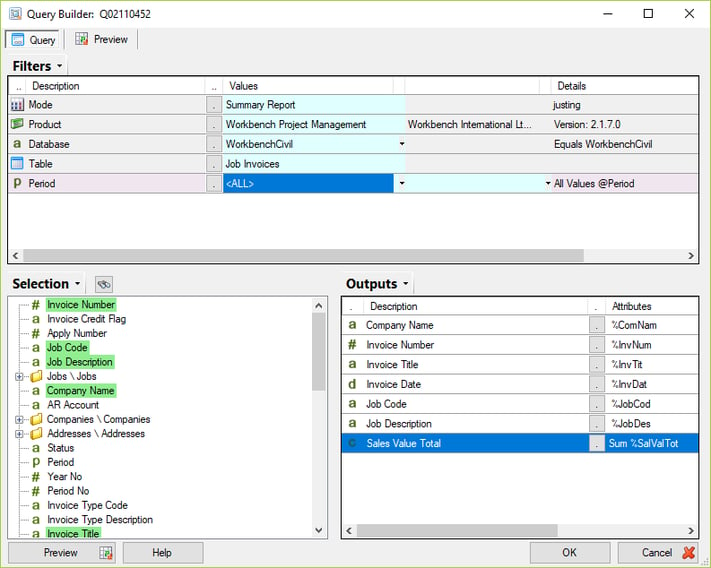
Select the main outputs for the report e.g. Client, Invoice No., Invoice Date, Job Code, etc.
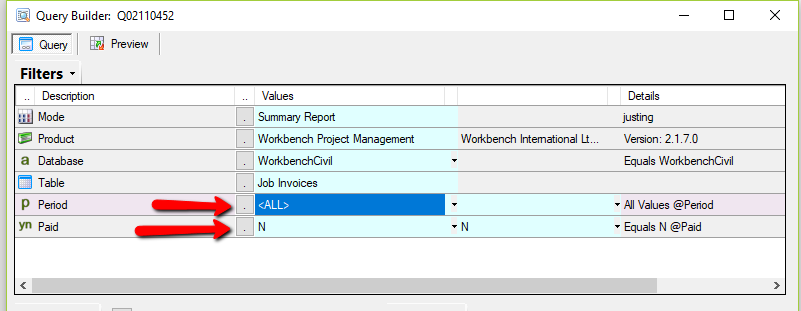
We will run this report based on dates so include all periods and also add the Paid field to the filter list. We want to set this to N so we are only including Invoices that are not flagged as Paid.
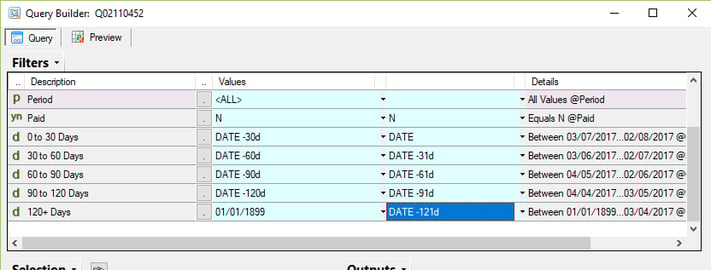
We then want to drag a number of Invoice Date filters onto the report. We will use these to create Filtered columns where we will display the Invoice balance so that we can show the aging.
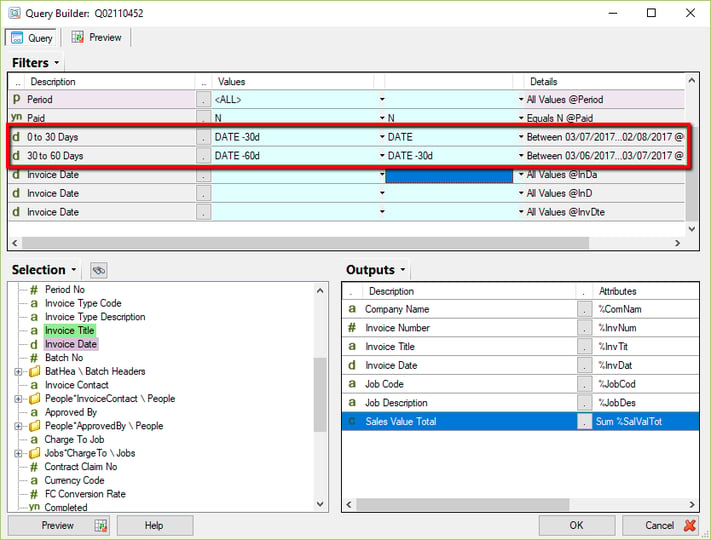
We will use the DATE parameter as part of the first aging column and then we will offset this date for all f the different aging periods we want to report. It is a good idea to rename the filters so that it is clear what they are and also specify the filter values for the aging columns.
To the right of the filter you will see the calculated dates that column will be filtering on. By using the DATE parameter the report will always calculate the aging starting from todays date. You may wish to using something different here like the period end date if so then you would need to set this as the first filter value in place of the date parameter.
Once you have finished, it should look something like this:
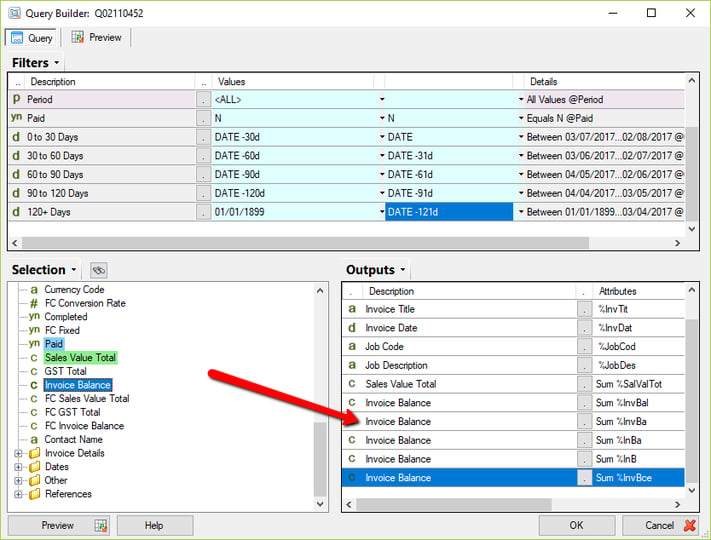
The next step is to output the Invoice balance and tie it to each aging filter.
It is a good idea to now rename the Invoice Balance fields also.
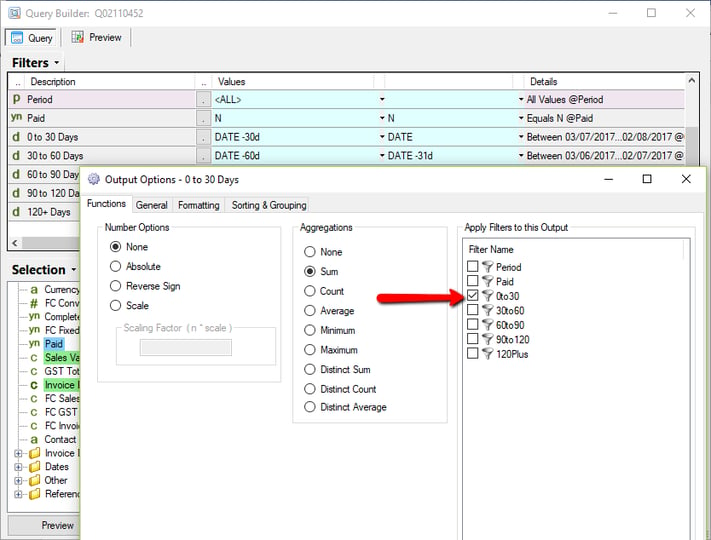
You then want to tie each filter to a specific date filter. In the above example, we have tied this value to the 0 to 30 days filter.
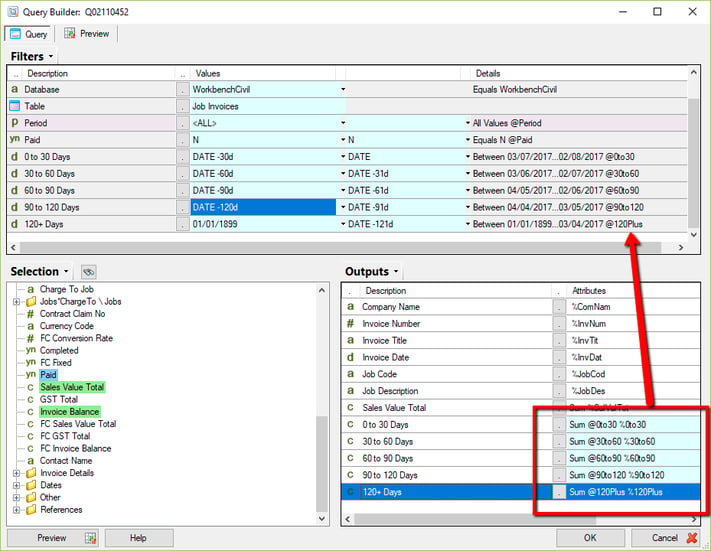
When you are finished, it should look like this. Notice the filter names on the outputs show which filters apply to which output.
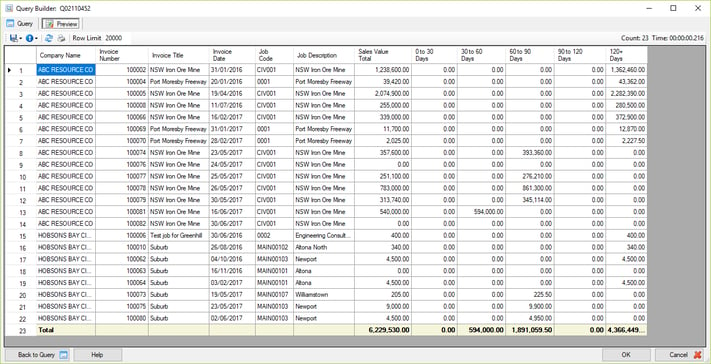
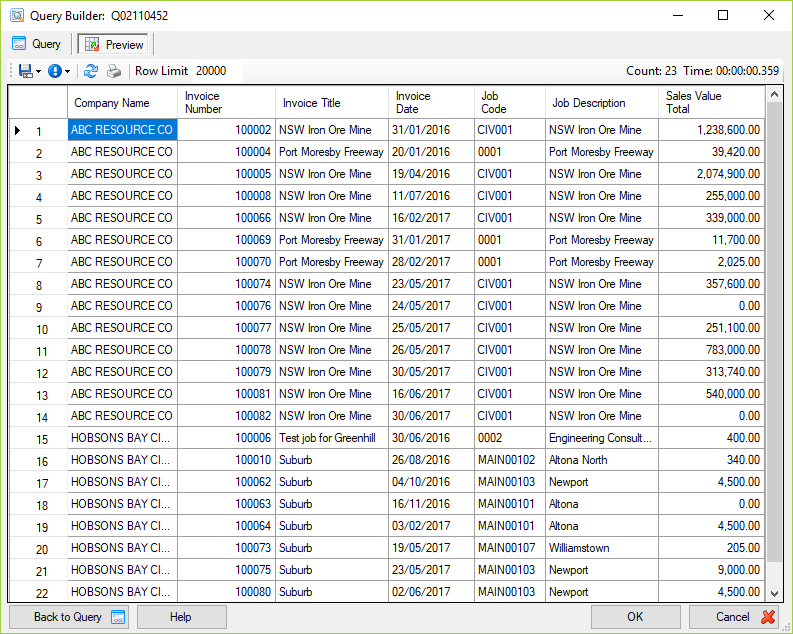
Preview your report and you should see that the invoice balances are now split across the aging periods.
Now that you have the basic data together, it is a good idea to save the report and then you can play around with some nice formatting. Some formatting ideas that look nice are:
- Specific column widths for the Balance columns
- Format the numbers to remove decimals
- Use Sorting and grouping options.
- Collapse table rows (do this when applying the sorting).
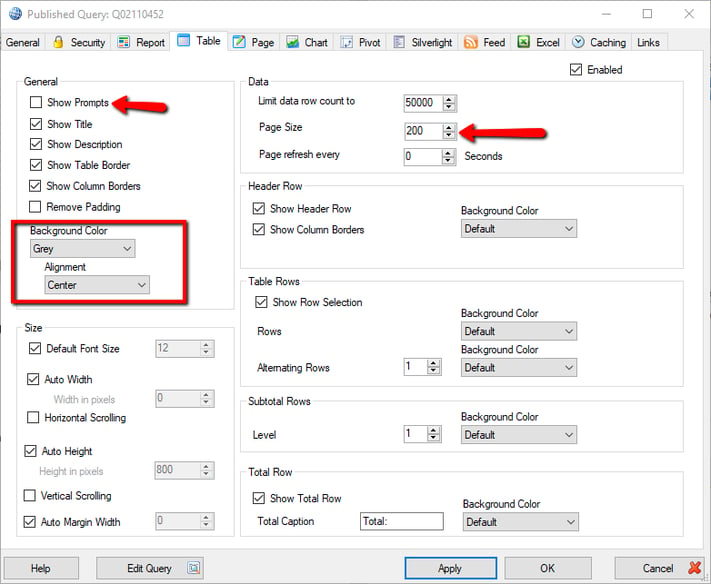
You can further refine how the report is presented using the Table tab under the query designer. With a few simple selections.
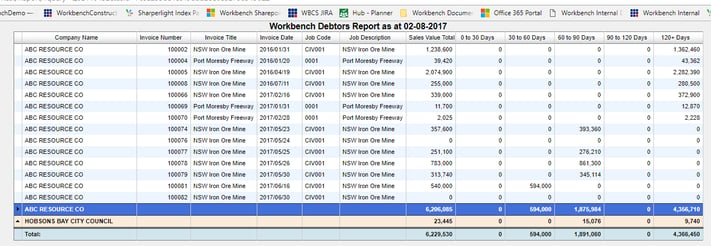
Now preview your report in the web, you should have something similar to the above.
You should be able to click on a client and expand to see the list of individual invoices outstanding.
Congratulations on creating your debtors report, remember you can apply these same concepts to other things you may wish to report out of Workbench.